
In this article we discuss the factors underpinning fears of a US recession, alongside the economic indicators that have led us to a more optimistic outlook.
At a glance:
- Financial markets got off to a rocky start this month after the jobs data released on 2 August sparked fears of a slowdown in the world's largest economy.
- However, jobs data should be weighed against other economic indicators such as household consumption, real wages growth, service sector strength, manufacturing activity, and government policy.
- On balance, we believe the evidence points towards a resilient US economy that should continue to provide returns for investors in the coming years.
Financial markets are subject to an endless stream of speculation, particularly during periods of higher volatility. At present, the possibility of a looming US recession is dominating media headlines and financial forums, alongside more optimistic counter-arguments.
Reuters reports that 76% of global fund managers canvassed in The Bank of America Global Fund Manager Survey are confident in a soft landing. Running between 2nd - 8th August, this was the most optimistic result of the survey since last summer, despite the highly volatile market conditions.
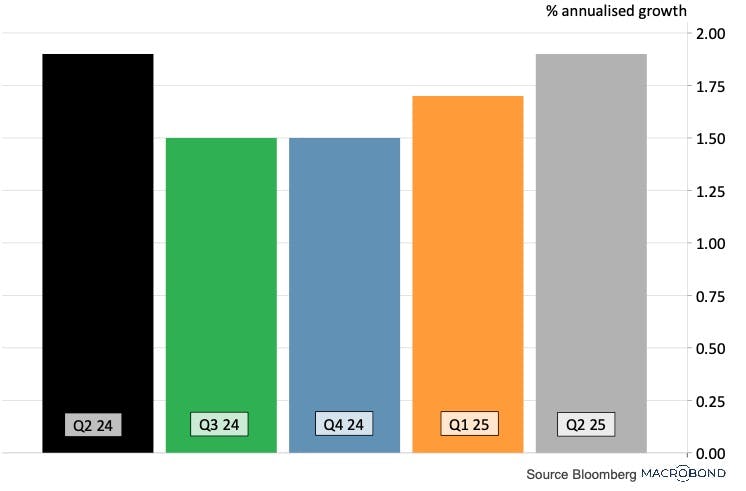
This is reinforced by a Bloomberg survey of US economists, whose median forecasts for the quarterly profile of economic growth don't include a recession.
Chart 1: Median Economist Forecasts of Quarterly US GDP
Source: Bloomberg, Macrobond (14 August, 2024)
While this is reassuring, many investors with globally diversified portfolios that include exposure to US stocks (such as those managed by Nutmeg) may still feel unsettled.
However, when assessing economic health, it is important to weigh up different indicators, and not to rely solely on the hype of media outlets or the speculation of financial service providers that may stand to gain from investor discomfort. Below, we take a look at the big picture, exploring what's driving fears of a US recession, as well as the reasons we think those fears are overblown.
Where has this recession alarmism come from?
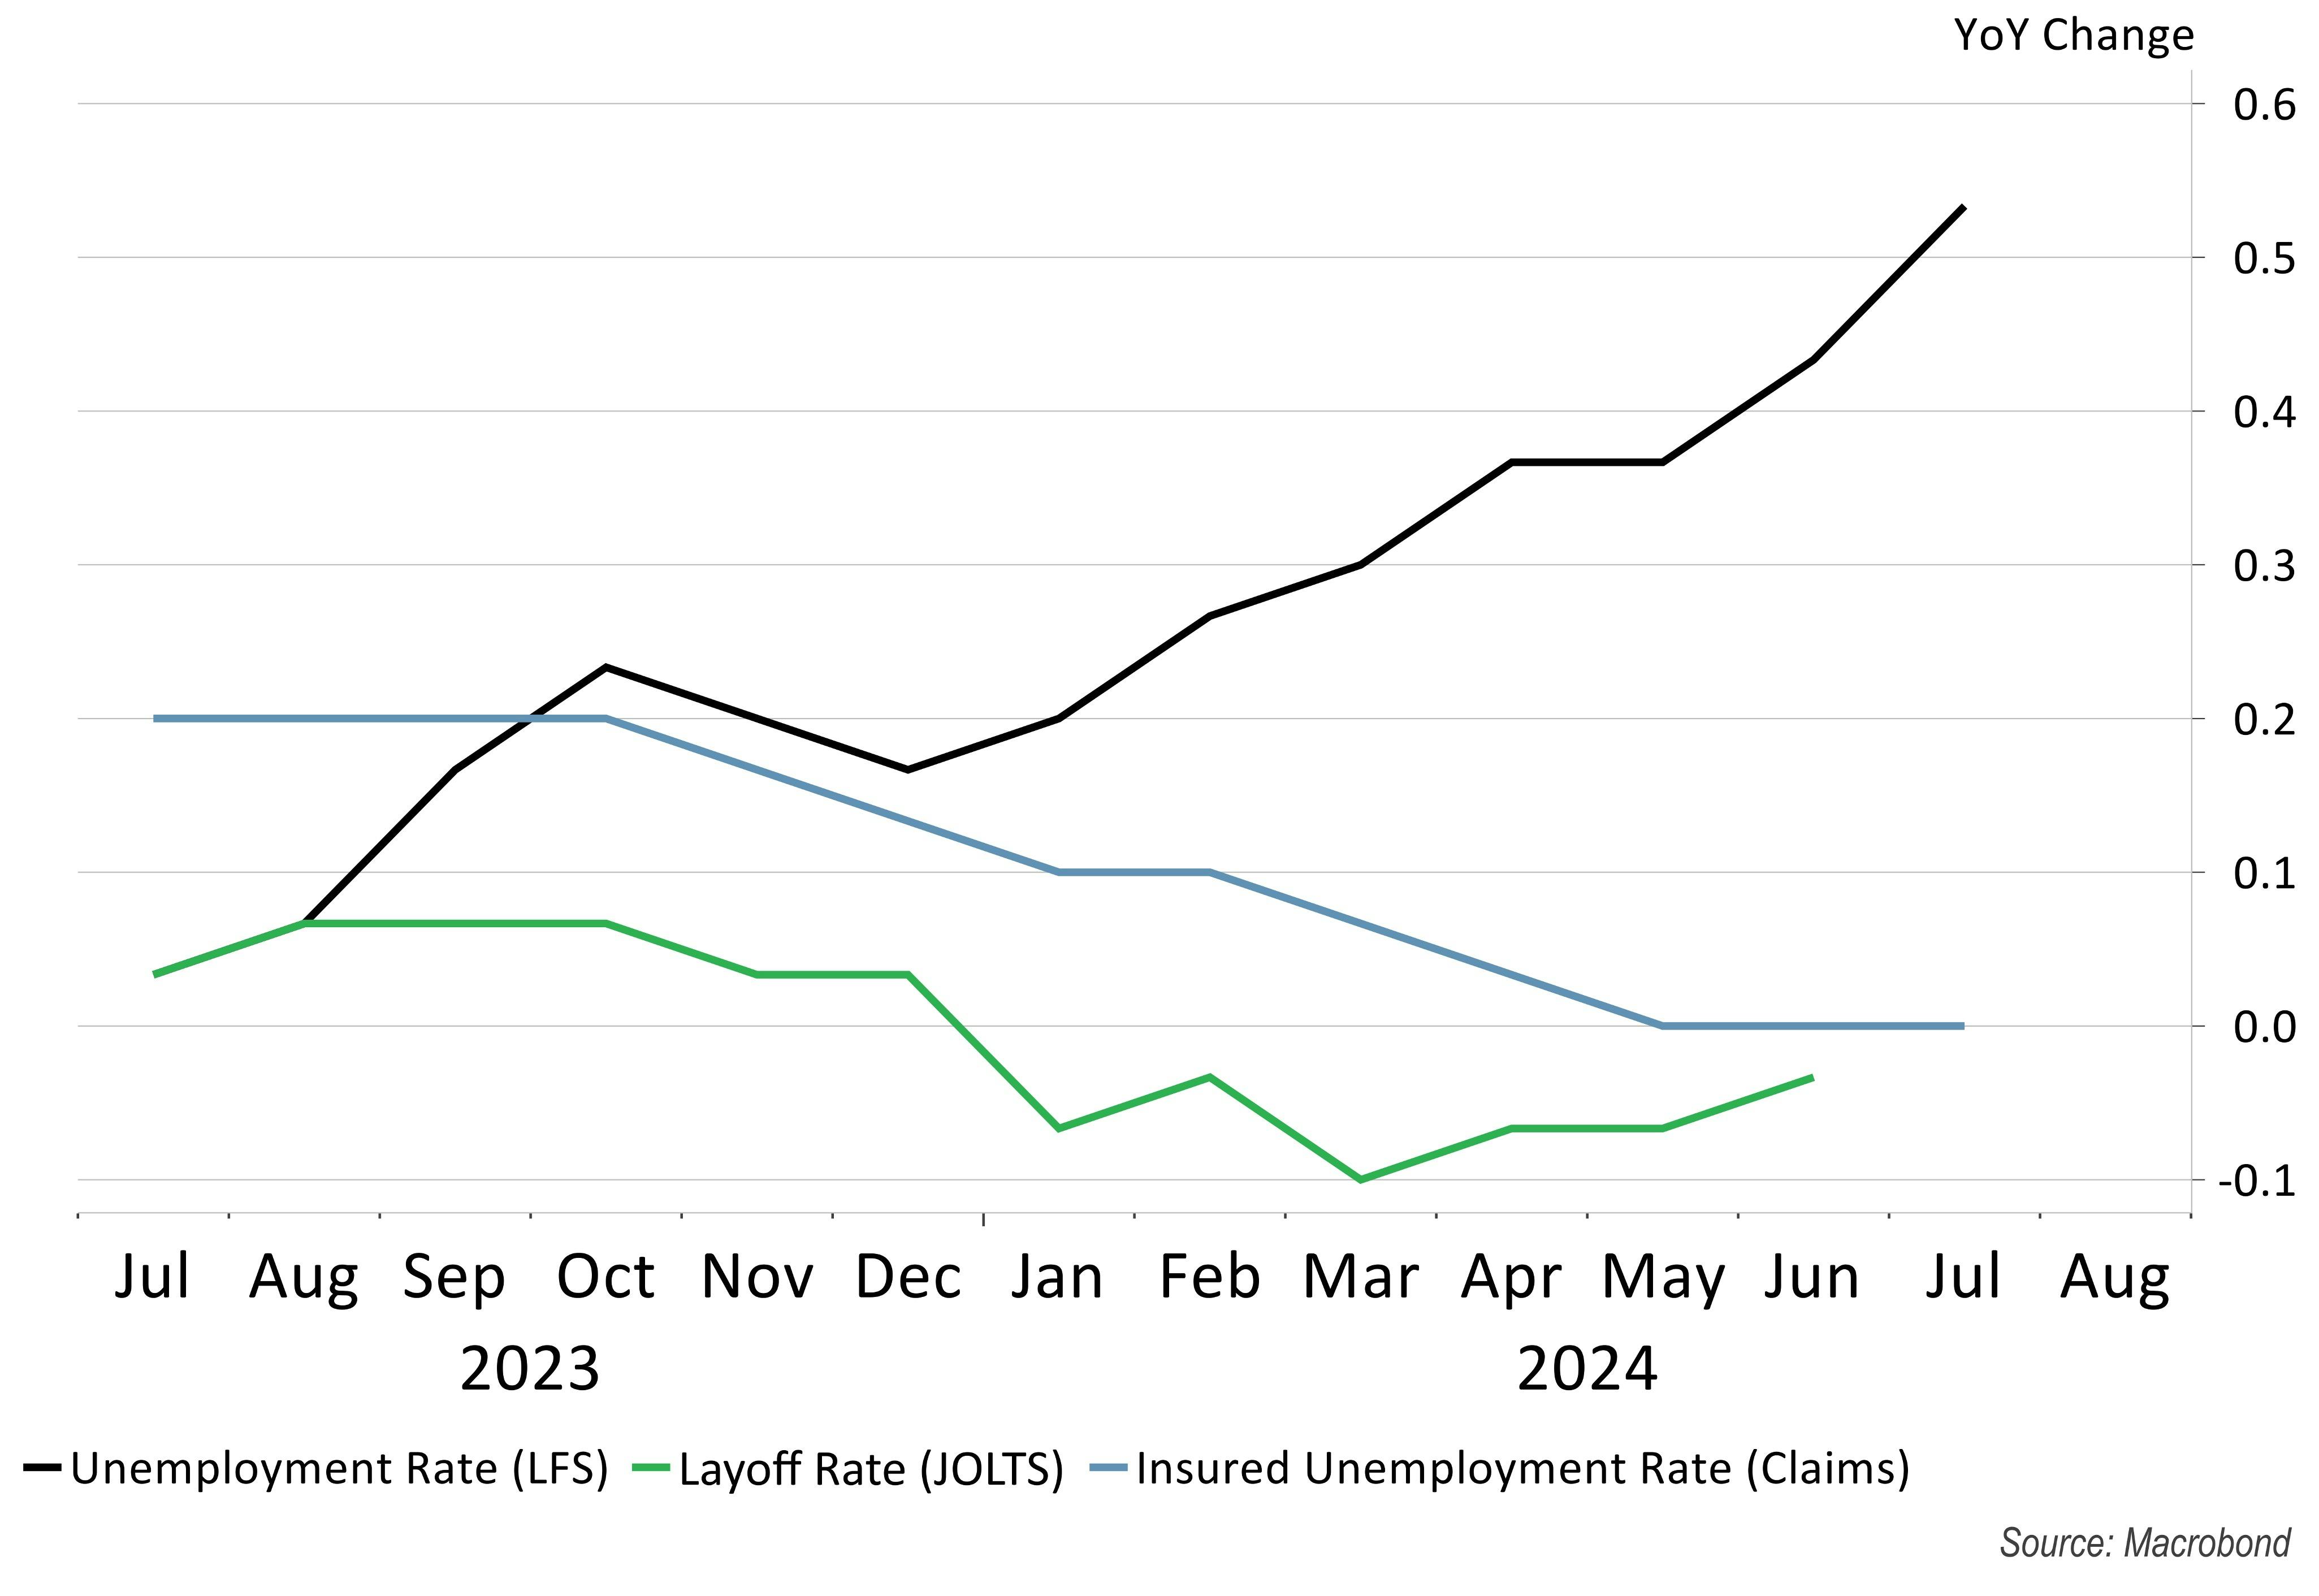
The primary catalyst of recession fears was sparked by the US jobs data report released on 2 August. The media latched on to this jobs report, focussing on the Labor Force Survey measure of unemployment, conducted by the Bureau of Labor Statistics. This is shown in the black line in Chart 2 below. This survey can experience sample accuracy problems similarly to the Office of National Statistics (ONS) here in the UK.
Chart 2: US Labour Market Conditions
Source: Nutmeg calculations, Macrobond (14 August, 2024)
However, there are three key ways to measure whether unemployment is rising, and of these, two suggest that unemployment trends in the US are not a significant issue.
The layoff rates and insured unemployment rate (two separate surveys of unemployment trends, shown in green and blue respectively) have not corroborated this message. Ordinarily, all three measures move together, so we should treat the Labor Force Survey measure with some caution.
While unemployment figures can be an indication of recession, Natasha May, Global Market Analyst at J.P. Morgan Asset Management adds an important caveat:
"A large part of the recent rise in the unemployment rate can be attributed to rising labour supply rather than layoffs. If the number of people looking for work is rising due to a rebound in immigration, this is potentially a less concerning signal than if companies are cutting jobs."
Why should we be optimistic about the outlook for the US?
1. Household consumption has strengthened since the start of the year
Chart 3: US Household Consumption Volumes
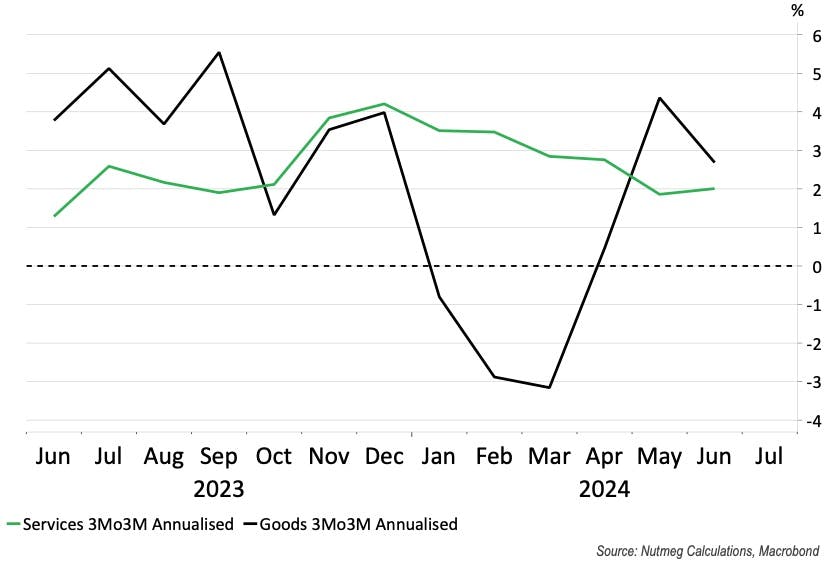
Source: Nutmeg calculations, Macrobond (14 August, 2024). Data compares the three-month growth rate with the previous three-month rate, as a percentage change (3Mo3M).
Services consumption growth has remained steady, hovering between 2% and 4% since the beginning of this year. Annualised growth in goods consumption was negative for the first three months of 2024 but has seen a strong rebound in Q2. This indicates that consumer confidence may be steadily returning.
2. Real wage growth is helping to offset higher interest rates
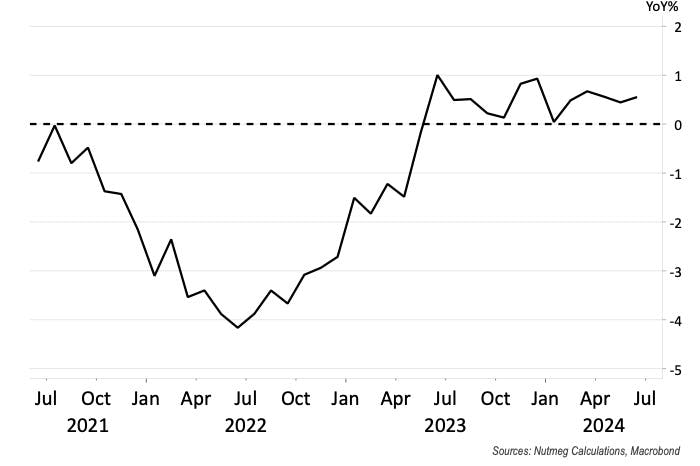
Chart 4: Real Weekly Wages
Source: Nutmeg calculations, Macrobond (14 August, 2024)
Real weekly wages growth is a measure of spending power after accounting for inflation. For the past year, growth in real wages has been positive, which means the average US consumer has more to spend on goods and services.
3. A recovery in manufacturing
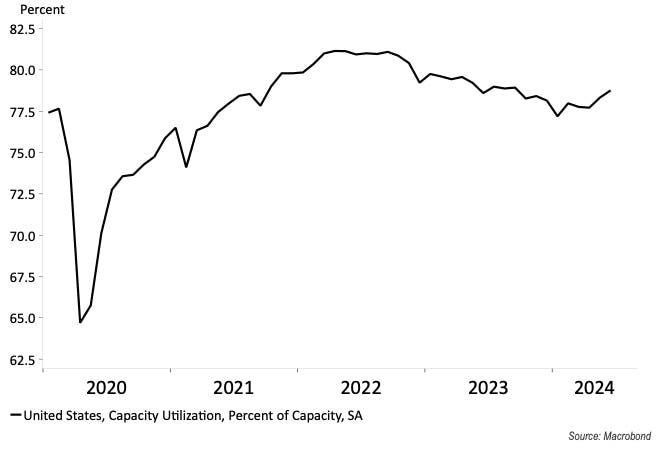
Chart 5: Manufacturing Activity
Source: Nutmeg calculations, Macrobond (14 August, 2024)
Manufacturers are operating at a higher capacity compared to the start of the year. This lines up with the increased consumption of consumer goods. The chart shows that manufacturing levels are higher than they were at the start of 2020 before COVID struck. It's also worth noting that although manufacturing is a key factor driving the economic cycle, it only accounts for around 10% of the US economy. The health of the services sector is also key to the underlying health of a modern developed economy.
4. Services continue to be a strong source of growth
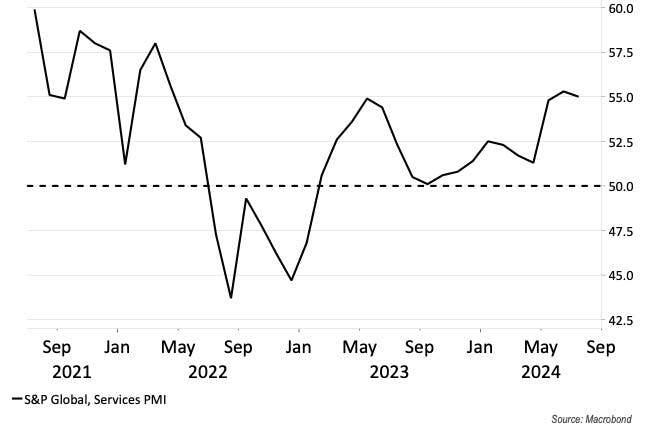
Chart 6: Services Purchasing Managers Index (PMI)
Source: Nutmeg calculations, Macrobond (14 August, 2024)
The service sector has been a strong source of positive growth. The Purchasing Managers Index (PMI), which measures service sector activity on a monthly basis, has been above 50 for most of the year. Anything above 50 indicates growth within the service sector, while anything below 50 indicates a slowing down or contraction. This signals an expansion of the sector and lines up with real income gains, which benefit both goods and services.
5. Pro-growth government policy
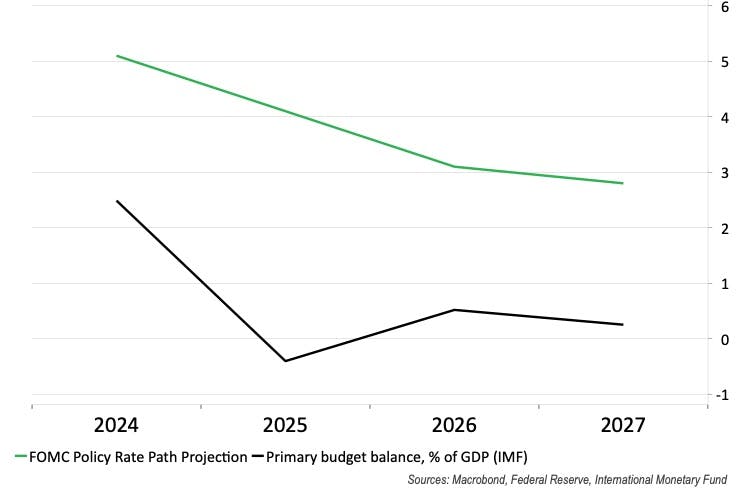
Chart 7: US policy projections look pro-growth
Sources: Macrobond, Federal Reserve, International Monetary Fund (14 August, 2024)
For most of 2024 and into early 2025, US government policy projections appear to be pro-growth. This can be seen by the black line in the chart which shows the International Monetary Fund's projections for the annual growth expected in government spending as a share of GDP. Positive readings show a pro-growth spending policy.
Interest rates are also expected to fall, as projected by the green line, which represents the mean expectation of the Federal-Open-Market-Committee (FOMC). This shows that monetary policy is likely to be less restrictive than it has been over the last couple of years.
Media headlines can make it difficult for investors to stay focussed, especially when too much weight is placed on a single trend or metric in isolation. While we can't predict the future with certainty, the above evidence leads our team to believe that fears of an impending US recession may be overblown.
As such, we increased our exposure to US equities in all our Thematics Portfolios (risk levels 5-10) as well as Fully Managed Portfolios (risk levels 3-10) on 8 August, including further holdings in the technology-focussed US Nasdaq. We also increased equity exposure in our SRI portfolios (risk levels 3-10), which includes some US equities.
As ever, the Investment team are paying close attention to the developments in the US and across the globe and stand ready to make changes to portfolios as we see fit.
Risk warning
As with all investing, your capital is at risk. The value of your portfolio with Nutmeg can go down as well as up and you may get back less than you invest. Past performance and forecasts are not a reliable indicator of future performance. Thematic investing carries specific risks and is not for everyone.
