We explain some of the ways earnings affect the performance of equities, and by extension, can have a big impact on how portfolios perform.
At a glance:
- Monitoring earnings growth remains crucial when investing in equity markets.
- While many factors are at play – including but not limited to GDP growth, the policy rate environment and currency – earnings remain by far the most relevant factor for equity returns over the long run.
- The price/earnings (P/E) ratio indicates how much investors are willing to pay (price) for a company as a multiple of its earnings per share. Changes to the P/E ratio are an important component of stock returns.
The strength of a company's earnings is an important indicator of its health, and can be a useful way to measure corporate health overall. Company earnings show how much profit a company has generated after the expenses of running it have been paid (including tax).
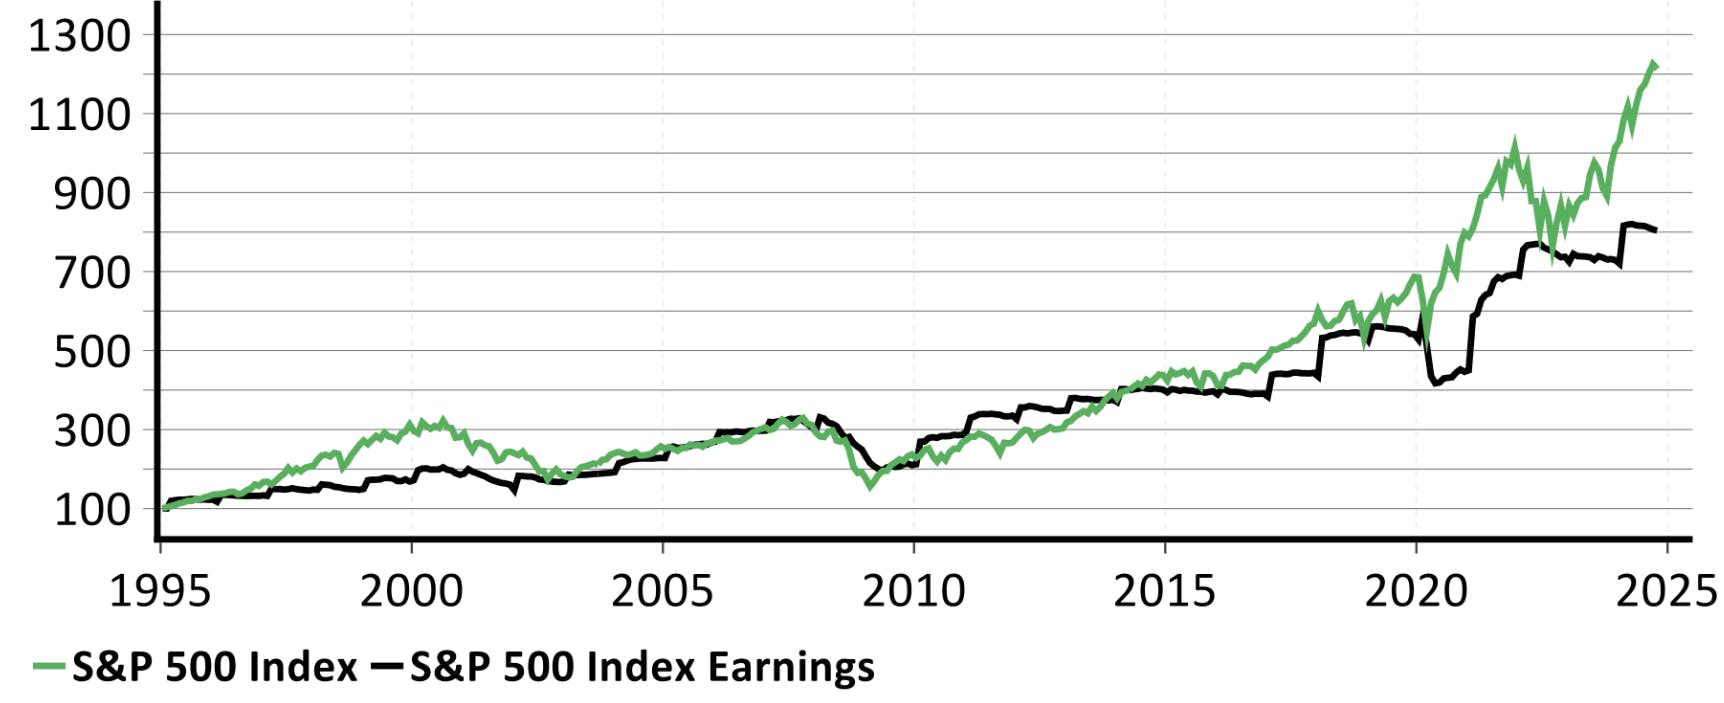
Earnings are very closely watched by investment professionals for good reason. Long-term, equity earnings growth tends to correlate strongly with equity market returns.
Chart 1: S&P 500 Historical performance and earnings growth

Source: Nutmeg, Macrobond, as at 4 December 2024
Here, we explain what investors need to understand about earnings, and why they can be such an important driver of portfolio performance.
What investors should know about earnings
Earnings are often reported as earnings per share (EPS), which is the company's last yearly earnings divided by the current number of shares. Using EPS standardises how investors look at earnings and avoids the impact of share numbers varying from one period to the next (the same is true if looking at an index). This makes it easier to measure and compare EPS over time.
There are two typical ways to look at earnings.
The first and simplest measure is what a company has earned in the last 12 months. This measure is usually final and not subject to estimation, but it has the drawback of being based on past, realised earnings. Performance might diverge substantially in the future. Therefore, forward 12-month earnings (or forward EPS) is often used in order to provide a measure of expected future earnings. The estimate of the coming year's earnings is often provided by large financial institutions like Bloomberg which aggregate many opinions from financial analysts at different banks or other financial institutions.
The price you pay for earnings remains a crucial measure to understand equity market dynamics
While earnings growth is needed for long-term positive equity returns, the price you pay for those earnings is also an important factor. To understand the performance of equity markets, investors should know when and how a stock's price/earnings (P/E) ratio comes into play.
Here, we explain some of the ways the Nutmeg investment team might interpret P/E ratios.
In simple terms, a P/E ratio reflects the multiple of earnings per share you might pay to invest in a company or an index, like the S&P 500. The maths is quite simple: Current price / earnings = P/E ratio.
In the below table we set out a couple of examples to make this clearer.
On 30 September this year, the value of the S&P 500 was 5,762 points when the market closed for the day. The expected index earnings for the next 12 months (forward 12m earnings) is 240 (also measured in points). Therefore, to buy one share equivalent of the S&P 500, one needed to pay around 24 times earnings (5,762/240).
Similarly, taking Microsoft, the price as of the end of September 2024 was about $429 per share. Expected EPS for the forward 12-months was $13.50, implying a Forward 12m price/earnings ratio of around 32.
Example of basic P/E ratio
Price/level | Earnings (forward 12-month earnings) | P/E ratio | |
|---|---|---|---|
S&P 500 | 5,762 | 240 | 24 |
Microsoft | $429 | $13.50 | 32 |
Source: Nutmeg, Macrobond. For illustration purposes only. Not an investment recommendation. As of 30 September 2024. P/E ratio is rounded to the nearest whole number.
Investors can use the P/E ratio to help them decide whether a stock or index looks more or less "expensive" based on where it has been over the long-term, or how earnings are expected to grow in the future (or both). More on this below.
Earnings can also help us understand equity returns better, helping us break down why a stock has performed the way that it has. The Nutmeg team might ask if, for example, investors are paying more because the company has already started to earn more? Or has something perhaps changed that makes investors expect earnings to be more stable in the future?
Equity return drivers for a given period can be broken down into three components
- Growth in earnings per share (EPS)
Typically, if the earnings of a single stock increase by a certain amount and the stock price is the same in terms of multiple of earnings per share, the price of the stock will increase accordingly. For example, a stock with a price of $30 and EPS of $2, has a P/E ratio of 15. If the earnings are estimated to grow to $3 per share, and the P/E of 15 times remains the same, the stock price should in theory be $45.
This is because: $3 (new earnings) x 15 (the same P/E ratio) = $45. - Change in price/earnings ratio
What if we changed a different part of the equation? If the P/E ratio of a stock (or an index) increases, the price of the stock or the index will increase accordingly. This is called a "rerating". It refers to a change in the amount investors are willing to pay for a company when earnings have not changed. As we mentioned earlier, something may have happened to trigger the change in demand, like an improvement in how much, or in how stable, earnings are expected to be in the future. This can happen at the company or the index level and can indicate more confidence in earnings further in the future. - Contribution from dividend yield paid
In the case of the US equity market, the dividend contribution is relatively modest. For some markets – like the UK – it can be a significant portion of the total return.
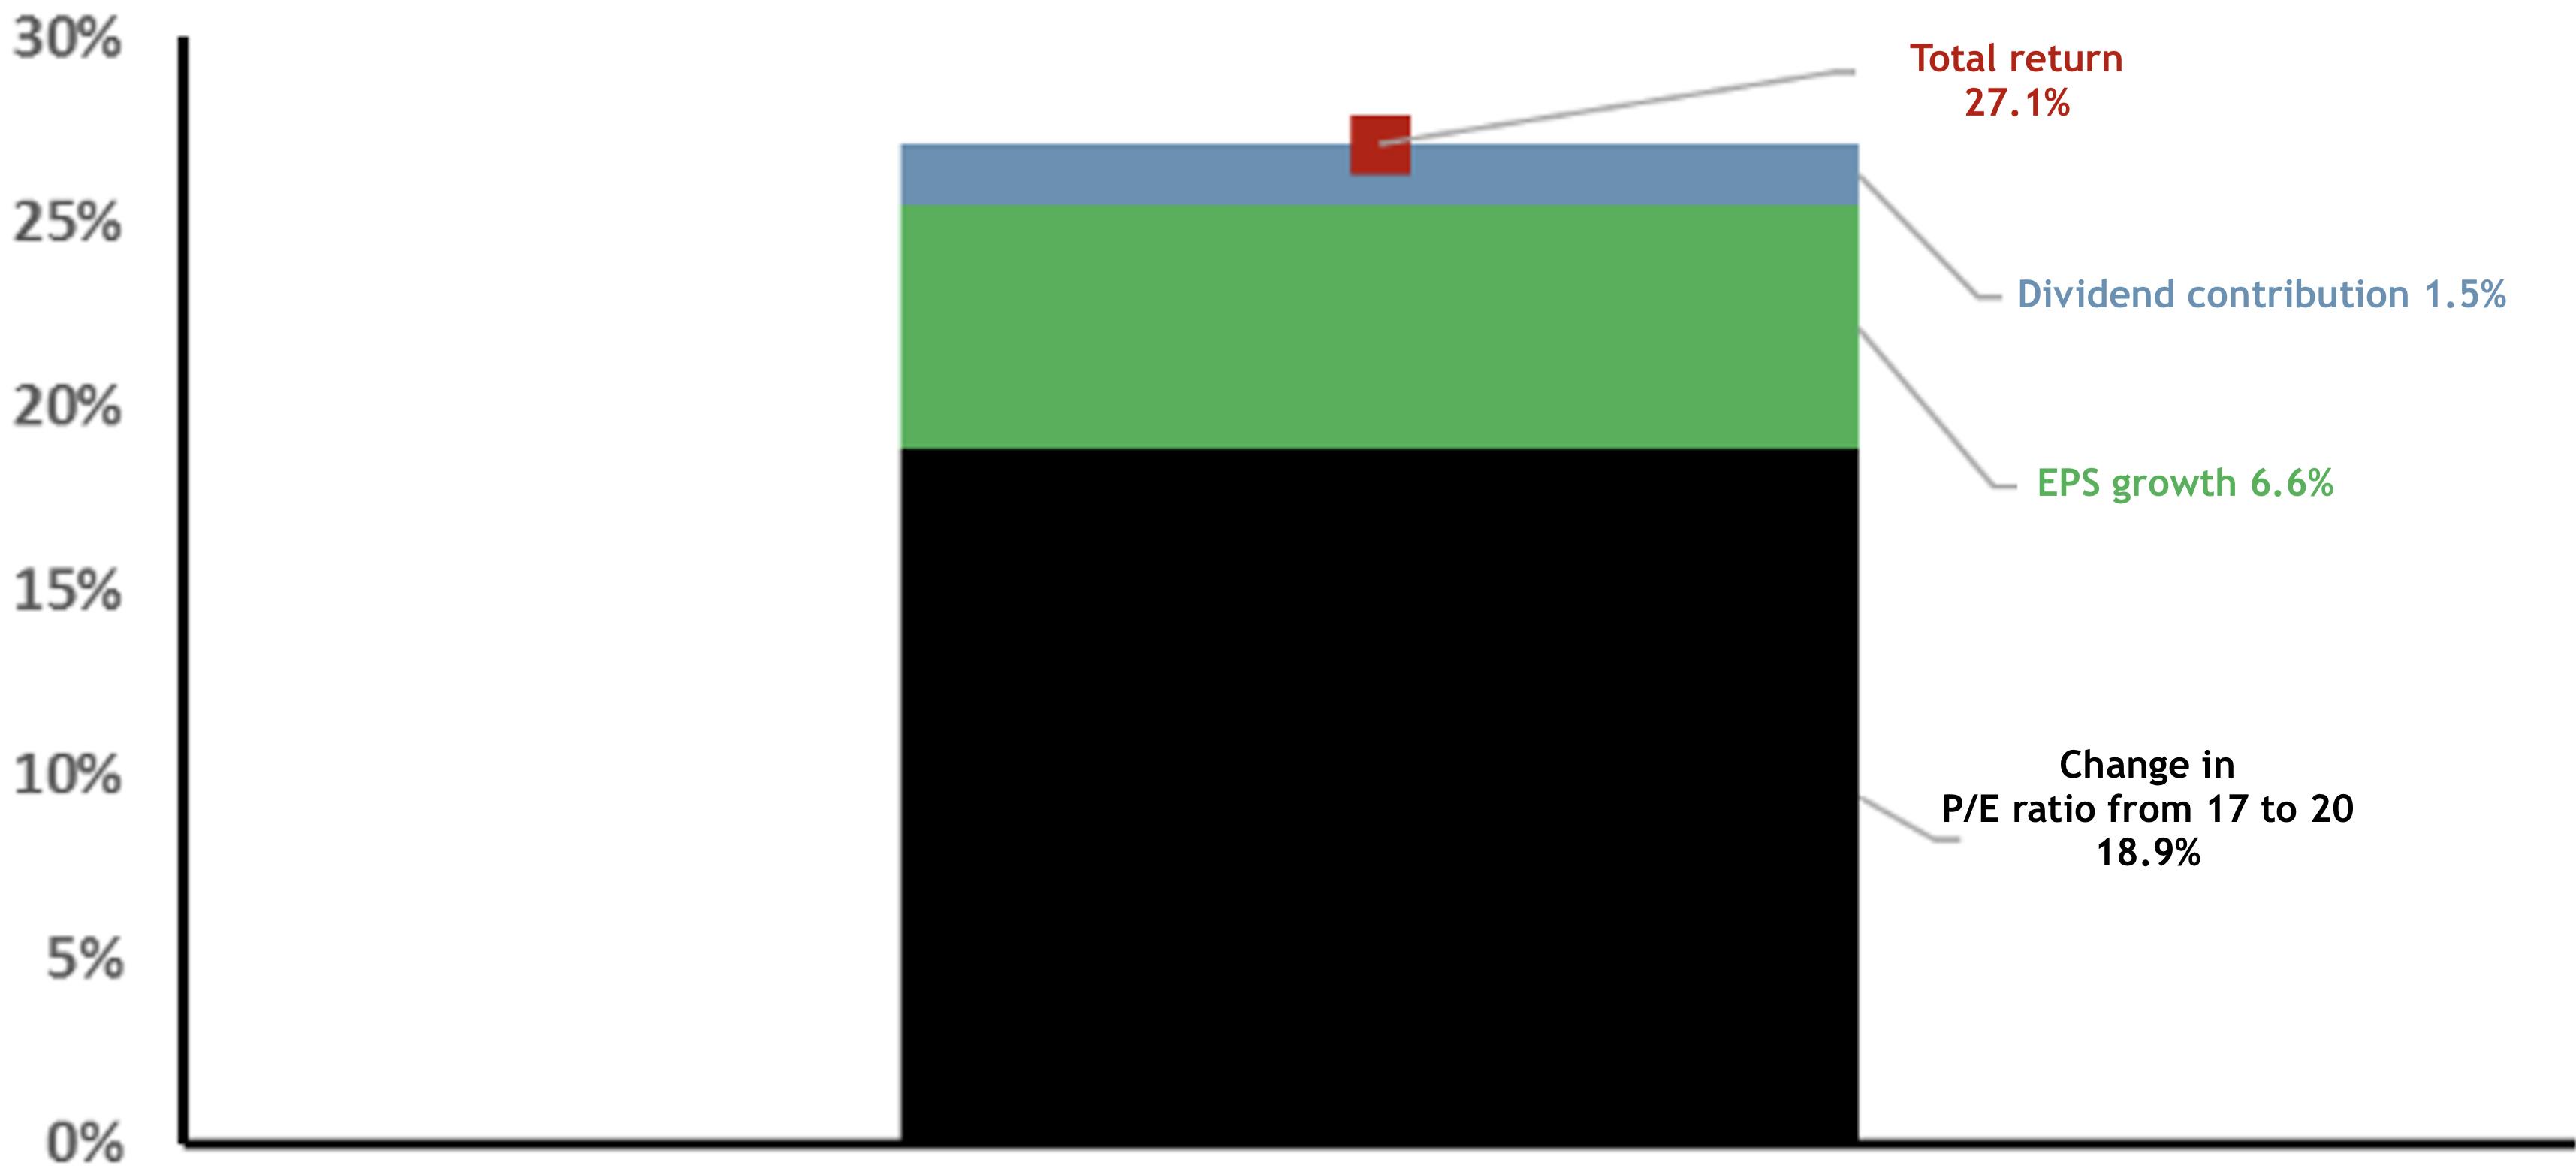
The chart below highlights the performance breakdown of the US equity market in 2023 (MSCI US index). All of the drivers above had a hand in the index rise, but the biggest contributor was the shift in P/E; essentially how much investors were willing to pay for the earnings generated by the companies in this index.
As can be seen, dividends contributed 1.7% of the total return and EPS growth added 6.6%. The largest part of the return was due to the P/E ratio rising, which contributed 18.9%. This is the "re-rating" referred to earlier. The P/E ratio increased from 17 at the end of 2022 to around 20 at the end of 2023. This fairly large increase in valuation explained most of the US yearly returns in 2023.
Chart 2: US equity – 2023 Total return breakdown

Source: Macrobond, MSCI, Nutmeg, 4 December 2024
It is worth noting that 2022 was a comparatively poor year, when equities ended the year at a relatively "attractive" level of valuation. "Attractive" can be subjective in investment. In this case, at the end of 2022 the forward P/E ratio of the S&P 500 was quite a long way below the 10-year "trailing average", which is a way of looking at short-term valuation moves versus a longer-term average. If the current P/E ratio of a company or index is below its long-term average, investors may expect it to return upwards to the average in time.
Over the course of 2023, the index rerated. As mentioned above, this means investors were willing to pay a higher multiple of earnings for the company or index. This rerating was helped by formidable earnings and expectations for the so-called US "mega caps". These are the very large companies like Amazon, Tesla, Alphabet (Google) and Microsoft.
How does the Nutmeg investment team use the P/E ratio?
The price/earnings ratio is a good indicator of how expensive or cheap an equity or equity market can be versus other companies, regions or versus its own history. However, it is a very unreliable indicator of short- to mid-term equity performance. Statistically, the link between P/E ratios and performance over a shorter time period is not strong.
Investors should not base investment decisions purely on P/E ratios, as many factors are at play. As touched on earlier in the article, P/E ratios are a useful starting point to understand broader company or market dynamics.
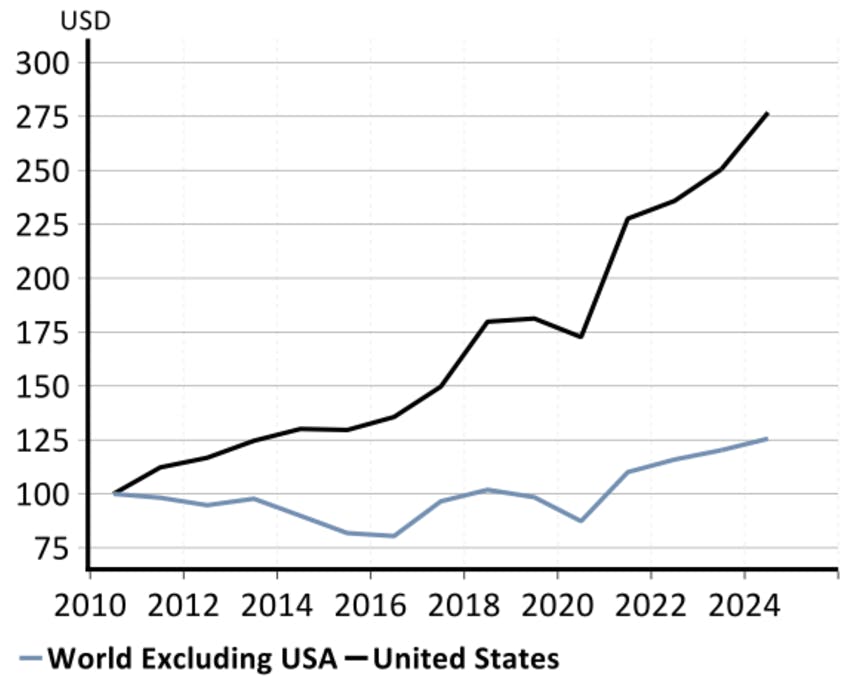
For example, US equities have a higher P/E ratio than most other developed markets (called "trading at a premium") versus other regions. However, they also benefit from very strong corporate earnings and robust US economic growth, especially post Covid. As a result, the US market has a high P/E versus other regions, but it is a premium valuation we believe US equities deserve. The chart below highlights as well how earnings growth differs between the US and the rest of the world. Earnings in the US have been growing much more strongly than elsewhere, and with the US economy on strong footing, we believe US earnings will remain supported.
Chart 3: Cumulative earnings – 2010 to 2024

Source: Macrobond, MSCI, Nutmeg, 4 December 2024
How are P/E ratios used by investors?
While P/E ratios are interesting for long-term equity expectations, it might be wisest to view the measure as a starting point for a deeper exploration of company or market prospects.
Because P/E ratios reflect the price of buying a stock or index as a multiple of one year's earnings, one very simplistic way investors could think about P/E is "how many years it will take the company to earn the market value of the company". If the P/E is 20, the company needs to earn at the same rate for 20 years to be worth what was paid for it, but two decades is a long time. That same company could become much larger, or it could hit some difficulties. The industry the company is in might be growing or shrinking.
P/E ratios are valuable, but only one small part of a much bigger conversation the investment team at Nutmeg will have when deciding if an investment looks attractive or not. They are however, very useful to frame how the market thinks about a company or a whole market, and begin to ask if it is justified.
Risk warning
As with all investing, your capital is at risk. The value of your portfolio with Nutmeg can go down as well as up and you may get back less than you invest. Past performance and forecasts are not reliable indicators of future performance. We do not provide investment advice in this article. Always do your own research.
